Vista Mapa 3D
QField displays spatial data in 3D by draping map layers as textures over terrain surfaces. The 3D view uses Eye Dome Lighting (depth shading) to enhance visual perception of terrain features, ridges, and valleys.
Configurando Datos de Elevación
QField processes 3D elevation data using two methods:
- Online DEM: Default elevation service fetched automatically over mobile networks.
- Custom DEM: Offline Digital Elevation Model raster dataset configured within your QGIS project.
Optión 1: MDE online
Trabajo de campo
If no custom elevation data is configured in your QGIS project, QField attempts to fetch a global online DEM to generate 3D terrain on the fly.
Note
Constraints for using the automatic online DEM:
- CRS Requirement: Project Coordinate Reference Systems (CRS) must use projected unit measurements (such as Pseudo-Mercator EPSG:3857 or UTM projections) rather than geographic degree units.
- Connectivity: Mobile devices require an active internet connection to download online terrain tiles.
Opción 2 : MDE Personalizado
Project Manager
Configure custom elevation data directly in QGIS for offline fieldwork and high-accuracy terrain rendering. Read more in the QGIS Elevation Properties Documentation.
Flujo
- Open your project in QGIS.
- Navigate to Project > Properties... > Terrain.
- Select your terrain source:
- Flat terrain: Assumes a flat 0 m elevation baseline across all map layers.
- DEM (Raster Layer): Selects a raster layer (such as a GeoTIFF) inside your project as the terrain elevation model.
Navegación por la vista 3D
Trabajo de campo
QField supports interactive panning and zooming within the 3D map canvas.
Navigate 3D map extents using touch or mouse controls:
Touch Interactions:
- Extent Mode Toggle: Tap the four-arrow toggle icon to switch map extent control modes. When active, drag with one finger to pan the 3D map canvas, or pinch two fingers to zoom in and out.
- Center on Location: Tap your blue positioning marker in 3D space to snap and center the camera over your current GNSS location.
Mouse Interactions:
- Pan Extent: Hold the
Shiftkey and drag the mouse to pan the 3D map extent. - Zoom Extent: Hold the
Shiftkey and scroll the mouse wheel to zoom in or out around the center point.
Identifying and Highlighting Features
Trabajo de campo
QField supports direct feature identification and selection highlighting inside the 3D map workspace without returning to 2D view.
Feature Identification
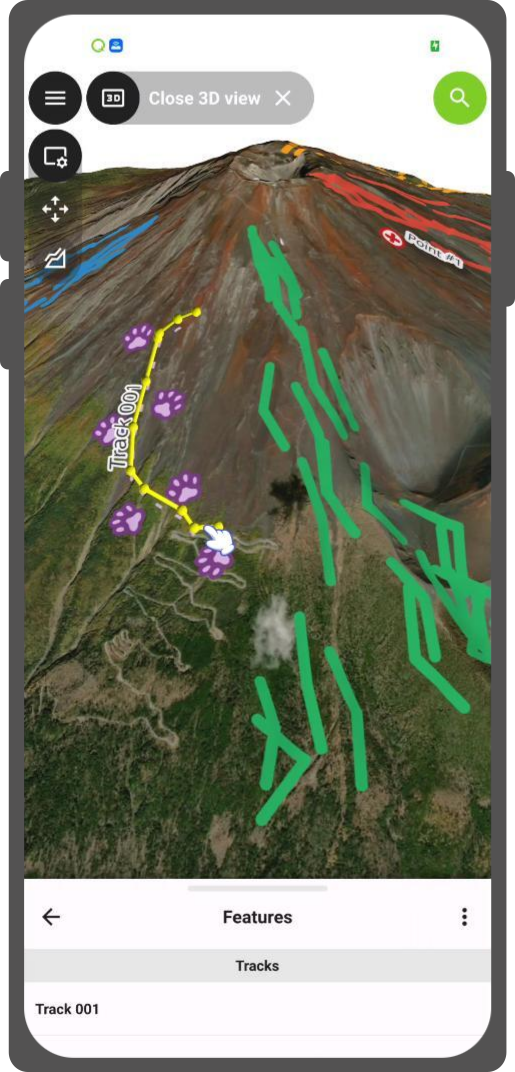
Tap anywhere on the 3D terrain canvas to query vector data. QField projects a ray onto the 3D surface, resolves intersecting feature coordinates, and opens the identification menu to view or edit feature attributes.
Selection and Highlight Geometry
When features are identified or selected, QField renders 3D highlight geometries over project features:
- Points: Rendered as 3D UV spheres resting over coordinate positions.
- Lines: Extruded into 3D tubes connected by spherical joints.
- Polygons: Outlined with 3D extruded tubes along boundary rings and filled with semi-transparent horizontal mesh planes.
Color Feedback Coding
3D feature highlights adjust color based on interaction states:
- Yellow Highlight: Identifies previewed feature list entries.
- Red Highlight: Displays features holding active UI focus in the identification list.
- Theme Primary Color: Highlights features explicitly added to multi-selection lists.
Visualizing GNSS and Tracking
Trabajo de campo
The 3D map view integrates with active positioning tools:
- GNSS Location: Displays your live position as a pulsating 3D marker draped on terrain surfaces. When moving, the marker transforms into a directional heading arrow.
- Tracking: Active tracking paths render dynamically as 3D tubes conforming to terrain contours.
Position markers and track lines adjust automatically to 3D terrain elevations with visual height offsets to prevent terrain clipping.
2D and 3D Extent Synchronization
Transitioning into or out of 3D view triggers camera animations between flat 2D perspective and pitched 3D views. QField updates the 2D map bounding box automatically to match navigated 3D extents, maintaining view synchronization across display modes.